
Summary —
This paper discusses the software programming of an Arduino weather station based on an ESP32-WROOM-32 microcontroller board that powers a 3.2 inch ILI9341 TFT display (320×240 pixels, 16-bit color). Local / regional weather data are downloaded from an OpenWeatherMap server in the form of a JSON object, processed and displayed.
Introduction —
Information about the weather is available from a variety of sources. For people living in Western Europe with its ever changing weather situations easy access to this kind of information can be very handy.
One can distinguish ‘microclimate registration stations’ that typically collect interesting data in the immediate environment of a person, say inside or immediately around the home, while inside that home maybe in a particular room, office, basement or attic. For this purpose a simple Arduino can be wired with a range of sensors designed to measure environmental parameters like barometric pressure, temperature, humidity, CO2, light intensity, UV radiation, fine dust and so forth. I built several of such ‘microclimate’ data collecting, displaying and logging indoor Arduino-based devices. Examples are a desktop room climate station* and a ‘sniffer box**. One can also distinguish a true ‘weather station’ that reports regional, national or even continental weather conditions. The challenge here is to build one’s own weather station that uses information picked up from the internet. There are several weather services and airports that continuously broadcast weather reports. Relatively new are internet services and private companies such as OpenWeatherMap, an open source community. OpenWeatherMap makes these data available as JSON strings that can be parsed and then processed and forwarded to a display. To achieve this is the purpose of the present project. The hardware platform is the ESP32-WROOM32-ILI9341 TFT display test bench published on TheSolarUniverse at WordPress.com on March 1, 2021*** (figure 1). The ESP32 microcontroller platform is particularly attractive because is is fast, budget-friendly, has much more memory than a common Arduino, is fully supported by the Arduino IDE, has wifi on board and is supported by powerful libraries for internet connectivity and for display. Especially mentioned here should be Bodmer’s extensive ‘TFT_eSPI’ library. A nice sketch snippet for display is the Rainbow Circular Scale Gauge, earlier published by Bodmer****.

figure 1. Weather station running on the test bench: ESP32-WROOM-32 microcontroller board and a 3.2 inch 320*240 TFT display with ILI9341 controller. JSON data obtained from OpenWeatherMap are presented numerically and with several gauges.
TFT displays equipped with ILI9143 controller
ESP82 microcontroller boards support displays that are much larger than OLEDs. Displays that I experience as matching the ESP32 very well are the 2.8” or 3.2” TFT displays with an ILI9341 controller chip and SPI interface. The ILI9341 is a fast controller whose graphical functionality is fully supported by a library written specifically for ESP32 microcontroller support by Bodmer: TFT_eSPI.h. This library can be installed in your Arduino IDE via the IDE’s Library manager.
Wiring of an ILI9341 SPI TFT display with an ESP32-WROOM-32
An ILI9341 SPI TFT display has a single row of 14 pins (figure 2). Eight of these pins are used to control the display while the remaining serve touch functionality and SD card support. The pinout of the display is presented as a table in figure 2. This is the wiring used in the current weather station.
The display shown in figures 1 and 2 has a touch screen. The pins supporting ‘touch’ as well as the pins connecting the SD card reader are not connected: we concentrate on displaying text, variables, graphics and fast sequences of bitmaps (‘image frames’).
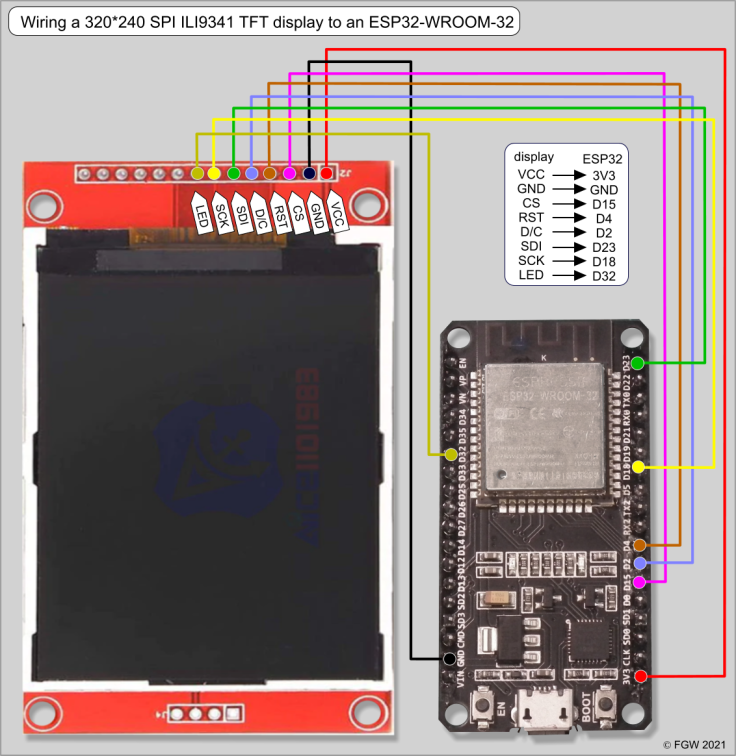
figure 2. 14-pin SPI TFT with wiring scheme and pin connection table. the microcontroller board is an ESP32-WROOM32.
OpenWeatherMap
OpenWeatherMap.org is a company specialized in the distribution of global weather data (https://openweathermap.org). Data for 200,000 locations on earth is continuously available. Although the firm offers a repertoire of (mostly) commercial products, one of their services is a free subscription to a limited amount of weather data, say a ‘teaser’. One can obtain a free API, capped to a generous 60 calls per minute or a one million calls per month. Perfect for the hobbyist.
Once one has registered at OpenWeatherMap.org and an API key has been obtained, software programming can start.
Structure of the weather station sketch
In brief, the weather station sketch proceeds through the following steps:
in void setup ():
- Establish a connection with the local wifi network,
- Setup the display and construct the static elements of the graphical presentation through the function ‘drawAllWindowFrames ()’,
- Run the function ‘doTheHardWork ()’ which – as its name implies – carries the workload:
in void loop ():
3.1. Establish a connection with the server at http://www.openweathermap.org and download via a http-GET instruction the JSON document containing the regional weather data,
3.2. Calculate the dynamic elements of the graphical presentation,
3.3. Send results of these calculations to the upper part of the display as dynamic alphanumerical data.
3.4. Call functions that govern the various dials, charts and gauges. These are: ‘rainbowScaleMeter ()’, ‘needleMeter ()’, ‘circleSegmentMeter ()’, ‘compassGauge ()’, ‘compassPointer ()’ and ‘windSectorReporter ()’.
In void loop a timer is set and the value of this timer forwarded to the function ‘doTheHardWork ()’. The timer is necessary to adhere to the conditions of the Openweathermap.org API
Parsing the JSON Document
The document received is a string in JSON notation. In my case:
JSON object = {“coord”:{“lon”:4.4931,”lat”:52.1583},”weather”:[{“id”:804,”main”:”Clouds”,”description”:”overcast clouds”,”icon”:”04d”}],”base”:”stations”,”main”:{“temp”:279.47,”feels_like”:277.62,”temp_min”:278.71,”temp_max”:279.82,”pressure”:1024,”humidity”:88},”visibility”:10000,”wind”:{“speed”:0.89,”deg”:325,”gust”:1.34},”clouds”:{“all”:100},”dt”:1615904762,”sys”:{“type”:3,”id”:2009098,”country”:”NL”,”sunrise”:1615874031,”sunset”:1615916851},”timezone”:3600,”id”:2751773,”name”:”Leiden”,”cod”:200}
If you transfer the coordinates “lon” and “lat” to Google Maps they cause the city center of my hometown: Leiden, The Netherlands, to be displayed on my computer’s screen.
Parsing of the downloaded string into JSON object-value pairs is performed by instructions in the library ‘Arduino_JSON.h’, and the only thing the current sketch does is to send the values of the objects “temp”, “pressure”, “humidity”, “wind” {“speed”} and “wind” {“deg”} to the display. Temperature is provided in degrees Kelvin, needing conversion to degrees Celsius (or degrees Fahrenheit if you wish). Wind speed is in meters per second and “deg” represents the compass direction where the wind comes from, with ‘0’ being North, 090 being East, 180 being South and 270 being West. Degrees need to be converted into radials wherever positions of needles or pointers in the graphical representation need to be calculated. Note also that the JSON string consists of an interesting set of data of which my weather station sketch selects only a few for display. All data are otherwise printed to Serial Monitor.
Display divided into windows
A screen 240 pixels wide and 320 pixels high has sufficient space to host several windows. Apart from the Title frame the screen is in the current sketch subdivided into seven subscreens, each surrounded by a frame. In void Setup() the function ’drawAllWindowFrames ()’ is called that contains the TFT_eSPI instructions to generate window frames. These frames are drawn with rounded corners: tft.drawRoundRect (x,y,width, height, radius of corner quarter circle). One frame is reserved for the alphanumerical representation and four frames serve graphical gauges.
Dynamic alphanumerical weather data
Figure 3 highlights the upper left part of the display where selected dynamic weather data are printed in white color: temperature, barometric pressure, humidity, wind speed and wind direction. The characters printed in yellow are the static elements in this window.
Font: The default font of the ILI9341 does not spectacularly catch the eye. Fortunately the TFT_eSPI.h library is accompanied with several font libraries that contain more pleasing fonts than the ILI3941 default font. Here used is the font “FF1“ defined in the library “Free_fonts.h” Note that a copy of this font library needs to be present in the folder containing the weather station sketch.

figure 3: Alphanumerical window of the display.
Scales and gauges
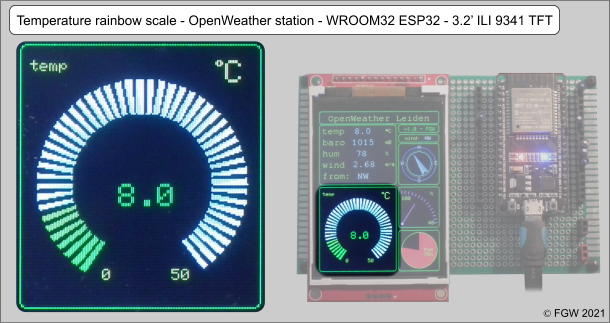
figure 4. Rainbow scale temperature gauge window.
Rainbow scale
The left half of the display contains the alphanumerical window and the window showing Bodmer’s Rainbow Scale Gauge (figure 4). This gauge consists of a series of circularly arranged segments. Segments are built up in the function ‘ringMeter ()’. Each segment consists of two triangles whose colors are controlled by a function called ‘rainbow ()’. The higher the temperature, the more segments become colored, with yellow in the lower temperature segments transforming to red colored segments at high temperatures. The rainbow scale range is set in the sketch between zero and 50 degrees Celsius. With outside temperatures below the freezing point the scale segments remain in neutral color while the numerical value is displayed with a minus sign.
Wind compass gauge

figure 5. Wind compass gauge.
The right upper window in the display graphically represents the wind direction: the wind compass gauge (figure 5). On top of the compass gauge window is a small window that contains the alphanumerical wind sector indicator.
The sketch contains three functions governing this part of the graphical presentation: ‘compassGauge ()’, ’compassPointer ()’, and ’windSectorReporter ()’. ‘CompassGauge ()‘constructs the graphical compass while ‘compasPointer()‘ calculates the position of the compass indicator and the wind sector. Feed for compassPointer is the JSON object “deg”. The value of “deg” is transferred to the variable windDir.
The compass indicator consists of two triangles positioned back-to-back. They share the tip: x and y coordinates for the tip are calculated from windDir. The wind sector reporter determines which sector of the compass rose corresponds with the windDir via a series of ‘if’ instructions.
Humidity gauges
Two humidity gauge windows are incorporated in the right lower sector of the display: a humidity indicator with a needle and a visual indicator based on a circular pie chart gauge (figure 6).
Needle indicator
The challenge here was to control the needle angle (0-90 degrees) that covers a 60-unit trajectory, i.e., between 40% and 100% humidity, in a 90-degrees space. Further, the needle should turn counterclockwise while default needle indicator rotations are clockwise. The needle indicator is built up via two functions, one constructing the static portion: ‘drawScaleSmallGauge ()’, and the function ‘needleMeter ()’ that controls actual needle movement .
The value of the JSON object “humidity” is transferred to the float parameter ‘hum_01’ which in turn is converted into an int variable ‘hum_02’ because the gauge is too coarse to report decimals. Hum_02 is fed into the function that constructs the angle of the reporting needle.

figure 6. Humidity gauges
Pie chart humidity indicator
A visually attractive way of presenting percentages is the pie chart. While complete filled circles are easy to draw via the ‘tft.fillCircle ()’ function, the drawing of a pie chart has its own challenges. One may for instance draw a complete color filled circle and then superimpose a black segment. Another way is to draw a background color circle and then fill part of it – a sector – with (360-n) radials where n corresponds with the percentage reported relative humidity. This what the current sketch does.
Also in this part of the sketch there is a function that controls the static part of the operation: ‘circleSegmentMeter ()’, and a function constructing the actual pie segment: ‘fillSegments ()’.
Note on using the TFT_eSPI library
Workflow with the TFT_eSPI library works differently than with other libraries. A main difference is that the TFT display’s controller is defined in a custom user setup file that is saved in the library folder. How to proceed with a workflow once you have installed the TFT_eSPI library has been described in the post ‘ESP32-WROOM-32 and ILI9341 TFT display – an interesting match’ ***.
Sketch
Note that the sketch needs five libraries for compilation:
#include “TFT_eSPI.h”
#include “WiFi.h”
#include “HTTPClient.h”
#include “Arduino_JSON.h”
#include “Free_Fonts.h”
Downloadable:
Sketch named: ‘ESP32_ILI9341_openweathermap.ino’
This sketch is packed in a ZIP file (inside a folder structure that also contains “Free_Fonts.h”).
The folder included in the ZIP file also has “Free_Fonts.h” as that library is required to display text in ‘mono’ font.
References
*An 128×64 graphic LCD display with ST7920 controller for the Arduino, displaying temperature and relative humidity. Thesolaruniverse.wordpress.com – august 11, 2017.
**Sniffer box 2: updated portable weather station with ESP8266-wifi – Thesolaruniverse.wordpress.com – February 7, 2021.
***ESP32-WROOM-32 and ILI9341 TFT display, an interesting match – Thesolaruniverse.wordpress.com – March 1, 2021.
***Arduino Analogue ‘ring’ Meter on Colour TFT Display – Bodmer – Instructables com, March 17, 2015
url: https://www.instructables.com/Arduino-analogue-ring-meter-on-colour-TFT-display/

Hey Floris,
Thanks for that very nice mail about “My ESP32-WROOM-32 -ILI9341 TFT OpenWeatherMap station” but I’m still not able to download from your site. I still got these strengh warnings about “Bösartiger Virus erkannt. I made screen copies I can send to you.
So please Bitte again to my Email
Thanks a lot and sorry for any inconvenience.
Kurt
LikeLike
Hi Kurt, I have sent you the zip file through my private mail. Success!
LikeLike
Love your projects, Very well laid out and well commented.
Have a question about “#include ” is this the same library as “#include ” which is included in Arduino?
LikeLike
Hi Floris,
I was also unable to download the link.
Could you please email the zip file to me.
Many Thanks
Mark
LikeLike
Hello Floris , seems that gauge of wind is 180 degrees out of direction,look at the picture on your page says NW and needle is SE
rest is working well
LikeLike
Hi Hans,
I have always been confused by wind direction. The weathercock points its beak towards that compass sector where the wind comes from, while the wind flows to the opposite direction (you will notice when you pedal your bike in Holland!). What about a flag? it points with the wind, not to the wind.
As my compass pointer has the shape of a paper folded airplane that follows the flow of the wind I made it pointing such that it follows the wind flow.
You can easily change the pointer’s direction in this function:
// ######################################################################################
// # constructs the compass pointer – dynamic part of compass #
// ######################################################################################
here the pointer points in the direction where the wind flows to
change the expression:
compassAngle = ((windDir_01+90)*DEG2RAD);
into:
compassAngle = ((windDir_01-90)*DEG2RAD);
and now the pointer points in the direction where the wind comes from.
Success, Floris
LikeLike
After considering images of wind cocks, wind pointers and flags I decided to turn all wind compass pointers in my illustrations 180 degrees. It is as simple as that !
LikeLike
Hello
I would like to try this interesting project, but cannot download the file. You can help?
LikeLike
….cnnot download the file……. I assume the sketch.
here is the link: http://www.zonnepanelen.wouterlood.com/arduinostuff/ESP32_ILI9341_openweathermap.zip
–> this is on my private website which is not https, Chrome thinks that this is unsafe. Use Firefox instead.
LikeLike
Hello Floris. My name is David, I am in South Florida. This week we are going to have our first storm of the Hurricane season. After looking around, I chose your OpenWeatherMap station to play with during the storm. But it hasn’t gone well…
I see three problems. The first problem I cannot simply fix. Perhaps you can comment on that one. The second and third problems are easy to fix. I include information on all three issues below:
1. I get this error every time I compile:
‘JSONVar’ was not declared in this scope
This error refers to this line:
JSONVar myObject = JSON.parse (jsonDocument); JSON.typeof(jsonVar) can be used to get the type of the var
I am not familiar with using the ArduinoJson library – yet.
2. I think this line needs to be eliminated entirely:
#include
I have ArduinoJson already installed through the Library Manager. This is the correct line, which is already included in the sketch:
#include
So I deleted the #include line, and the error went away.
3. You are calling for updates every five minutes. Actually that’s too often according to the current OpenWeather guidelines where they say this:
“We recommend making API calls no more than once in 10 minutes for each location, whether you call it by city name, geographical coordinates or by zip code. The update frequency of the OpenWeather model is not higher than once in 10 minutes.”
For that (and more) see the second paragraph under the section “API care recommendations” in this page:
https://openweathermap.org/appid
To fix this I simply changed this line:
timerDelay = 300000; // connect to OpenWeather and refresh every five minutes
To this:
timerDelay = 600000; // connect to OpenWeather and refresh every ten minutes
BTW I am using a 2.8″ 240×320 ILI9341 + XPT2046 TFT LCD and the Espressif ESP32 DevKitC-VE V4 module, both of which are working OK with Bodmer’s TFT_eSPI library.
Thank You, David
LikeLiked by 1 person
Hi David,
Thank your for kindly informing me about imperfections in the json – ESP32 – ILI9341 weather sketch.
— You are quite right about the #include: the json library is called twice. I have updated the zipped sketch: removed the #include “ArduinoJson.h”
— In the updated sketch I have also increased the OpenWeather query interval to 10 minutes.
All the best and keep safe in Florida storms.
–by the way, the #include “SPI.h” is redundant as well. Bodmer’s library takes care of all SPI stuff.
Floris
LikeLike
FYI: In my previous post the editor eliminated the arguments in the include statements. The bad include statement’s argument is “Arduino_JSON.h”, while the good one is “ArduinoJson.h”. Regards, David
LikeLike
stops at signed line 627 during compilation }
How to fix it??
LikeLike
Hi Iuri63.
Line 627 is at he end of the draw segments function of the circle segment meter. A way to debug is to systematically comment out suspect sections of a sketch and recompile. in this way you might find the source of your troubles. BTW I ahve uploaded a new version ZIP sketch to this parts because there were some redundant calls to not-used libraries. This has nothing to do with line 627, though.
LikeLike
thanks floris. the error was on 2 computers.
but i will try your advice
LikeLike
The second day I try to correct the mistake in the sketch – it doesn’t work.
Please send the sketch you checked. I liked the weather station very much.
THANK YOU!
LikeLike
Please send me a verified sketch by e-mail.
Thank you
LikeLike
I can’t find the drivers for the ESP32
LikeLike
Hi Franco,
Do you mean Arduino IDE support for ESP32 boards or the JSON library?
For ESP32 support: click in the Arduino Interface on File –> Preferences. The Additional Boards Manager URLs should contain:
https://arduino.esp8266.com/stable/package_esp8266com_index.json,https://raw.githubusercontent.com/espressif/arduino-esp32/gh-pages/package_esp32_index.json
save, and after that you will see that Tools—>Board Manager will show all the ESP32 and ESP8266 boards.
Success, Floris
LikeLike
Thanks for your answer, but maybe I did express myself not in the right way. The board is installed OK, but the serial port need a driver or else ESP32 will not be recognized, for instance the CP210….driver
LikeLike
Oops, this is Windows stuff. I work most of the time with Linux. No idea. Post a question on the Arduino forum.
LikeLike
Drivers OK, my faults, I was trying it with windows 11
LikeLike
Hallo Floris,
I came across your ESP32 Weatherstation and it looked very nice.
I downloaded the zip file. Unzipped it and changed the necessary lines. Then compiled it and it verified ok.
After that I tried to upload the sketch to an ESP-Wroom32. Unfortunately it will not upload.
I got the following message:
Compilation complete.
“/Users/ebwijkstra/Library/Arduino15/packages/esp32/tools/esptool_py/3.1.0/esptool” –chip esp32 –port “/dev/cu.usbserial-0001” –baud 921600 –before default_reset –after hard_reset write_flash -z –flash_mode dio –flash_freq 80m –flash_size 4MB 0xe000 “/Users/ebwijkstra/Library/Arduino15/packages/esp32/hardware/esp32/2.0.2/tools/partitions/boot_app0.bin” 0x1000 “/private/var/folders/5y/r4sggwnj00qfn93ly5t2q6580000gn/T/arduino-sketch-45B441CD9F23F523C2F9380552D1D1AF/ESP32_ILI9341_openweathermap.ino.bootloader.bin” 0x10000 “/private/var/folders/5y/r4sggwnj00qfn93ly5t2q6580000gn/T/arduino-sketch-45B441CD9F23F523C2F9380552D1D1AF/ESP32_ILI9341_openweathermap.ino.bin” 0x8000 “/private/var/folders/5y/r4sggwnj00qfn93ly5t2q6580000gn/T/arduino-sketch-45B441CD9F23F523C2F9380552D1D1AF/ESP32_ILI9341_openweathermap.ino.partitions.bin”
esptool.py v3.1
Serial port /dev/cu.usbserial-0001
Connecting…….._____….._____….._____….._____….._____….._____….._____
A fatal error occurred: Failed to connect to ESP32: Timed out waiting for packet header
Upload error: Failed uploading: uploading error: exit status 2
I must say it is a Chinese version and might be faulty. I have another one but this one too is definitely faulty. No power on the uC. What would be your advice? Just use it for the waste-paper-basket, I think.
Best regards,
Eb W.
LikeLike
Dag Eb, groetjes uit Nederland,
I bought a couple of cheap ESP32s from different Chinese vendors via AliExpress and they all arrived AND worked, so maybe your ESP32 works fine but for some reason is not available for upload.
a few suggestions:
— check your Arduino IDE. Is the IDE up to date with all boards supported? Did you select in Tools -> Board –> Boards Manager the correct board ( ESP32DevModule)? Solution: update boards. Nuclear option: uninstall and reinstall Arduino IDE with all the new board support
— check your usb cable. Some of these cables do not really support reliable hi-frequency data transfer. Solution: Change cable
— run a simple test instead of trying to upload from the cold a complex weather station sketch. My standard suggestion: select under File –> Examples –> 01. Basics –> Blink. This is my standard test for all microcontroller boards after delivery.
— finally: try to upload from a different computer. My standard computer has a Linux distri as OS, while my laptop runs Windows 10. I tested the weather station before release on both types of OS. All tests were positive.
This is it for the time being. Success, Floris
LikeLike
Goede morgen Floris,
Thank you for your quick reply.
I put another ESP Wroom32 on and off it went like the clappers. No problem at all.
��Bڱ …..
12:5:00.889 -> Connected to WiFi network Wijkstra – IP adress: 192.168.68.67
12:5:01.966 -> timer set to 30 seconds (timerDelay variable) – it will take 30 seconds before publishing the first reading.
12:5:02.728 -> HTTP Response code: 200
12:5:02.760 -> *******************************************
12:5:02.792 -> JSON object = {“coord”:{“lon”:5.25,”lat”:52},”weather”:[{“id”:803,”main”:”Clouds”,”description”:”broken clouds”,”icon”:”04n”}],”base”:”stations”,”main”:{“temp”:280.6,”feels_like”:278.51,”temp_min”:279.81,”temp_max”:281.49,”pressure”:1025,”humidity”:79},”visibility”:10000,”wind”:{“speed”:3.13,”deg”:264,”gust”:5.81},”clouds”:{“all”:63},”dt”:1643497367,”sys”:{“type”:2,”id”:2009768,”country”:”NL”,”sunrise”:1643527338,”sunset”:1643559724},”timezone”:3600,”id”:2745909,”name”:”Provincie Utrecht”,”cod”:200}
12:5:03.336 -> *******************************************
12:5:03.368 -> extracted from JSON object:
12:5:03.400 -> Temperature: 280.6 *Kelvin
12:5:03.433 -> Pressure: 1025 mB
12:5:03.465 -> Humidity: 79 %
12:5:03.497 -> Wind Speed: 3.13 m/s
12:5:03.497 -> Wind Direction: 264 degrees
12:5:03.529 -> Wind from: W
12:5:03.561 -> Rainbowgauge: 7.6 *C
12:5:03.596 ->
So I put on the TFT screen. Unfortunately screen black, nothing on it. So now I have to figure out the correct pin numbers. Yours are for my uC not correct.
Mine is an ESP-WROOM32; R-211-161115; FCCID-2ACC7-ESPPWROO32 with a CE mark.
Set the counrty/city code to first to NZ-Invercargill and then to NL-Utrecht. Both worked perfect in the serial monitor as you can see.
Will keep you posted.
Met vriendelijke groet,
Eb W.
LikeLike
Ah, forgot to mention that TFT-eSPI comes with fantastic examples:
In teh Arduino IDE: File–> Examples –>TFT_eSPi and here pick your tool or just get amazed by what Bodmer has created.
LikeLike
Godd morning Floris,
Thank you for your replies.
Sorry to be a pine in the backside. but my knowledge of Arduino and programming is minimal.
Another proble I have is, my iMac does not start Arduino IDE unless it is v2.0, which is still experimental.
When I start eg v1.8.19 the splash screen appears with “initializing … and immediately shuts down. Why I have no idea. Went to Arduino blog. Still very little or no help at all.
At least I have v2.0 going but cannot open an .ino file directly from the folder tree. Have to go through v2.0 and then open the requested .ino file.
When i upload I get about 32 error messages. All have to do with tft.print and tft.println.
In char* the message says: ISO C++11 does not allow conversion from literal to ‘ char* ‘ and
No matching member function for call to ‘println’clang(ovl_no_viable_member_function_in_call)
Print.h(98, 12): Candidate function not viable: no known conversion from ‘TFT_eSPI’ to ‘Print’ for object argument
and another 31 similar message to follow.
To me it has something to do with the ESP32 I use and not having the correct pin numbers
I have not investigated you previous advice yet.
Thanks for your help.
Kind regards
LikeLike
Hallo Floris,
Have the sketch installed on the ES-Wroom32. I changed the pin numbers to
CS –> G05
RST –> G22
D/C –> G02
SDI –> G19
SCK –> G18
LED –> G15
SDO –> G23
The screen lights up but no images appear. The serial monitor is showing the info as in my previous email.
With other words, the sketch works. When I change the Country/City, it also changes in the serial monitor with the correct coordinates and city ID.
I know there are heaps of Chinese ESP32s with not always the same pin numbers associated with the correct input/output.
If I use the pin numbers as you have described, nothing happens and the screen stays black.
Any idea???
Kind regards,
Eb W.
LikeLike
Goede morgen, Eb,
At least your contraption receives the complete JSON string from OpenWeathermap.org and prints it to Serial Monitor. That’s the good news, because this reduces the problem to communication between your ESP32 and the display.
–> are you sure that your display has an ILI9341 controller? There are SPI pin layout displays out there with ILI9488 controllers that absolutely refuse to work unless you really hack them (I own one)
–> If your display has an ILI9341 on board then the next step is to check the libraries. The combination ESP32 – 320*240 ILI9341 SPI display works great with Bodmer’s TFT_eSPI library. However, the ‘constructor’ that describes the controller to the library is not inside the sketch (as is the case with Adafruit_GFX.h) but exists in the form of an ascii-editable file that is saved in the folder ‘User_Setups’ under the main folder ‘TFT_eSPI. You need to indicate (by uncommenting the correct line of instructions) in the file User_Setup_Select.h which of the User_Setup.h files is going to be used by TFT_eSPI. How this works is explained in my lrecent post, https://thesolaruniverse.wordpress.com/2022/01/02/quite-a-hard-nut-to-crack-the-0-96-inch-80160-spi-7735s-tft-display-driven-by-an-esp8266-or-esp32-microcontroller/
In conclusion: the sketch appears to work on the ESP32 and my gut feeling is that the TFT_eSPI library does not consult the correct, specific User_Setup.h (yet) and produces a white screen.
Succes, Floris.
LikeLike
Hallo Floris,
Sorry about all this.
I ahve made an editted User_settins.h file
Deleted all what was not needed.
/ USER DEFINED SETTINGS
// Set driver type, fonts to be loaded, pins used and SPI control method etc
//
// See the User_Setup_Select.h file if you wish to be able to define multiple
// setups and then easily select which setup file is used by the compiler.
//
// If this file is edited correctly then all the library example sketches should
// run without the need to make any more changes for a particular hardware setup!
// Note that some sketches are designed for a particular TFT pixel width/height
// ##################################################################################
//
// Section 1. Call up the right driver file and any options for it
//
// ##################################################################################
// Only define one driver, the other ones must be commented out
#define ILI9341_DRIVER // Generic driver for common displays
//#define ILI9341_2_DRIVER // Alternative ILI9341 driver, see https://github.com/Bodmer/TFT_eSPI/issues/1172
// ###### EDIT THE PIN NUMBERS IN THE LINES FOLLOWING TO SUIT YOUR ESP32 SETUP ######
// For ESP32 Dev board (only tested with ILI9341 display)
// The hardware SPI can be mapped to any pins
#define TFT_CS 05 // Chip select control pin
#define TFT_RST 22 // Reset pin (could connect to RST pin)
#define TFT_DC 02 // Data Command control pin
#define TFT_SDI 19 //MISO
#define TFT_SCLK 18 //Clock data
#define TFT_LED 15 // Chip select control pin
// #define TFT_RST -1 // Set TFT_RST to -1 if display RESET is connected to ESP32 board RST
// For ESP32 Dev board (only tested with GC9A01 display)
// The hardware SPI can be mapped to any pins
//#define TFT_MOSI 15 // In some display driver board, it might be written as “SDA” and so on.
//#define TFT_SCLK 14
//#define TFT_CS 5 // Chip select control pin
//#define TFT_DC 27 // Data Command control pin
//#define TFT_RST 33 // Reset pin (could connect to Arduino RESET pin)
//#define TFT_BL 22 // LED back-light
//#define TOUCH_CS 21 // Chip select pin (T_CS) of touch screen
//#define TFT_WR 22 // Write strobe for modified Raspberry Pi TFT only
// For the M5Stack module use these #define lines
//#define TFT_MISO 19
//#define TFT_MOSI 23
//#define TFT_SCLK 18
//#define TFT_CS 14 // Chip select control pin
//#define TFT_DC 27 // Data Command control pin
//#define TFT_RST 33 // Reset pin (could connect to Arduino RESET pin)
//#define TFT_BL 32 // LED back-light (required for M5Stack)
// ##################################################################################
//
// Section 3. Define the fonts that are to be used here
//
// ##################################################################################
// Comment out the #defines below with // to stop that font being loaded
// The ESP8366 and ESP32 have plenty of memory so commenting out fonts is not
// normally necessary. If all fonts are loaded the extra FLASH space required is
// about 17Kbytes. To save FLASH space only enable the fonts you need!
#define LOAD_GLCD // Font 1. Original Adafruit 8 pixel font needs ~1820 bytes in FLASH
#define LOAD_FONT2 // Font 2. Small 16 pixel high font, needs ~3534 bytes in FLASH, 96 characters
#define LOAD_FONT4 // Font 4. Medium 26 pixel high font, needs ~5848 bytes in FLASH, 96 characters
#define LOAD_FONT6 // Font 6. Large 48 pixel font, needs ~2666 bytes in FLASH, only characters 1234567890:-.apm
#define LOAD_FONT7 // Font 7. 7 segment 48 pixel font, needs ~2438 bytes in FLASH, only characters 1234567890:-.
#define LOAD_FONT8 // Font 8. Large 75 pixel font needs ~3256 bytes in FLASH, only characters 1234567890:-.
//#define LOAD_FONT8N // Font 8. Alternative to Font 8 above, slightly narrower, so 3 digits fit a 160 pixel TFT
#define LOAD_GFXFF // FreeFonts. Include access to the 48 Adafruit_GFX free fonts FF1 to FF48 and custom fonts
// Comment out the #define below to stop the SPIFFS filing system and smooth font code being loaded
// this will save ~20kbytes of FLASH
#define SMOOTH_FONT
// ##################################################################################
//
// Section 4. Other options
//
// ##################################################################################
// For the RP2040 processor define the SPI port channel used (default 0 if undefined)
//#define TFT_SPI_PORT 1 // Set to 0 if SPI0 pins are used, or 1 if spi1 pins used
// For the STM32 processor define the SPI port channel used (default 1 if undefined)
//#define TFT_SPI_PORT 2 // Set to 1 for SPI port 1, or 2 for SPI port 2
// Define the SPI clock frequency, this affects the graphics rendering speed. Too
// fast and the TFT driver will not keep up and display corruption appears.
// With an ILI9341 display 40MHz works OK, 80MHz sometimes fails
// With a ST7735 display more than 27MHz may not work (spurious pixels and lines)
// With an ILI9163 display 27 MHz works OK.
// #define SPI_FREQUENCY 1000000
// #define SPI_FREQUENCY 5000000
// #define SPI_FREQUENCY 10000000
// #define SPI_FREQUENCY 20000000
#define SPI_FREQUENCY 27000000
// #define SPI_FREQUENCY 40000000
// #define SPI_FREQUENCY 55000000 // STM32 SPI1 only (SPI2 maximum is 27MHz)
// #define SPI_FREQUENCY 80000000
// Optional reduced SPI frequency for reading TFT
#define SPI_READ_FREQUENCY 20000000
// The XPT2046 requires a lower SPI clock rate of 2.5MHz so we define that here:
#define SPI_TOUCH_FREQUENCY 2500000
// The ESP32 has 2 free SPI ports i.e. VSPI and HSPI, the VSPI is the default.
// If the VSPI port is in use and pins are not accessible (e.g. TTGO T-Beam)
// then uncomment the following line:
//#define USE_HSPI_PORT
// Comment out the following #define if “SPI Transactions” do not need to be
// supported. When commented out the code size will be smaller and sketches will
// run slightly faster, so leave it commented out unless you need it!
// Transaction support is needed to work with SD library but not needed with TFT_SdFat
// Transaction support is required if other SPI devices are connected.
// Transactions are automatically enabled by the library for an ESP32 (to use HAL mutex)
// so changing it here has no effect
// #define SUPPORT_TRANSACTIONS
I already have to weather stations going, ThingPulse and Zihatec. The Zihatec weatherstation has the same uM as what I am using for your sketch and works fine. Do not know how to send you an image.
I like your design.
Your advice please.
Met vriendelijke groet,
Eb W.
LikeLike
Got everything loaded up but the display goes blank white when the Wifi connects. If i rem out the Wifi actions, everything draws up just fine on the display. Stepping through the code progression, the display blanks out but the code still seems to be going out and fetching data. I’ve got some debugging print lines going to serial and it’s pulling the json and parsing through it just fine.
As soon as that wifi is connected though, the screen just goes blank.
I’ve tried changing the power around putting a dedicated supply to the LCD. I tried a brand new ESP32 Dev Kit module.
LikeLike
Hi! I made it,work fine. The display lights up on pin D14!
LikeLike
Establish a connection with the server at http://www.openweathermap.org and download via a http-GET instruction the JSON document containing the regional weather data????
Where do i find the JSON, because there is no GET on the side
LikeLike
Hi Ton, the GET statement is in the sketch!
LikeLike
Thank you. Was a bit confusing, but get out of it and it works.
LikeLike
Where can i find ‘ESP32_ILI9341_openweathermap.ino’. Because i get a virus warning
LikeLike
I found a other code. This one works
LikeLike
super!
LikeLike
How can i change the temp form Kelvin to Celsius??
LikeLike
Hi Floris!
Do you have any clue why the humidity info rectangles are not displaying info? In the main numerical rectangle the value for humidity is displayed. Thank you!
LikeLike
Hi Ion,
I have not programmed display of numerical humidity in the little ‘humidity’ rectangle with the pink needle and pink scale. You might try doing that yourself! Ciao, Floris
LikeLike
Which versions of the libraries have you used?
The most recent at the time of creating this project, I assume.
LikeLike
Hi Floris,
Thank you for the Weather station. I am rebuilding it now as I have gathered all the components as you described. Just one question: Can you publish or send us/me the the User_Setup.h file for the display you used? I ask you because I want to setup with the same Pins-setup as you proposed in the pictures above.
Thank you in advance,
Alex
LikeLike
Hi Alex, the ILI9341 TFT comes in two interface tastes: 1) SPI, 2. parallel. These, in combination with an ESP32, require different User_Setups with TFT_eSPI. Which combination do you need? – regards, Floris
LikeLike
Here is the user_setup.h:
// Setup_WROOM32_ILI9341_alex.h
#define ILI9341_DRIVER
// #define TFT_RGB_ORDER TFT_RGB // Colour order Red-Green-Blue
#define TFT_RGB_ORDER TFT_BGR // Colour order Blue-Green-Red
#define TFT_BL 32 // LED back-light control pin
#define TFT_BACKLIGHT_ON HIGH // Level to turn ON back-light (HIGH or LOW)
// ###### EDIT THE PIN NUMBERS IN THE LINES FOLLOWING TO SUIT YOUR ESP32 SETUP ######
// For ESP32 Dev board (only tested with ILI9341 display)
// The hardware SPI can be mapped to any pins
// #define TFT_MISO 19
#define TFT_MOSI 23
#define TFT_SCLK 18
#define TFT_CS 15 // Chip select control pin
#define TFT_DC 2 // Data Command control pin
#define TFT_RST 4 // Reset pin (could connect to RST pin)
// #define TFT_RST -1 // Set TFT_RST to -1 if display RESET is connected to ESP32 board RST
// ##################################################################################
//
// Section 3. Define the fonts that are to be used here
//
// ##################################################################################
// Comment out the #defines below with // to stop that font being loaded
// The ESP8366 and ESP32 have plenty of memory so commenting out fonts is not
// normally necessary. If all fonts are loaded the extra FLASH space required is
// about 17Kbytes. To save FLASH space only enable the fonts you need!
#define LOAD_GLCD // Font 1. Original Adafruit 8 pixel font needs ~1820 bytes in FLASH
#define LOAD_FONT2 // Font 2. Small 16 pixel high font, needs ~3534 bytes in FLASH, 96 characters
#define LOAD_FONT4 // Font 4. Medium 26 pixel high font, needs ~5848 bytes in FLASH, 96 characters
#define LOAD_FONT6 // Font 6. Large 48 pixel font, needs ~2666 bytes in FLASH, only characters 1234567890:-.apm
#define LOAD_FONT7 // Font 7. 7 segment 48 pixel font, needs ~2438 bytes in FLASH, only characters 1234567890:-.
#define LOAD_FONT8 // Font 8. Large 75 pixel font needs ~3256 bytes in FLASH, only characters 1234567890:-.
// #define LOAD_FONT8N // Font 8. Alternative to Font 8 above, slightly narrower, so 3 digits fit a 160 pixel TFT
#define LOAD_GFXFF // FreeFonts. Include access to the 48 Adafruit_GFX free fonts FF1 to FF48 and custom fonts
// Comment out the #define below to stop the SPIFFS filing system and smooth font code being loaded
// this will save ~20kbytes of FLASH
#define SMOOTH_FONT
// ##################################################################################
//
// Section 4. Other options
//
// ##################################################################################
// Define the SPI clock frequency, this affects the graphics rendering speed. Too
// fast and the TFT driver will not keep up and display corruption appears.
// With an ILI9341 display 40MHz works OK, 80MHz sometimes fails
// With a ST7735 display more than 27MHz may not work (spurious pixels and lines)
// With an ILI9163 display 27 MHz works OK.
// #define SPI_FREQUENCY 1000000
// #define SPI_FREQUENCY 5000000
// #define SPI_FREQUENCY 10000000
// #define SPI_FREQUENCY 20000000
#define SPI_FREQUENCY 27000000
// #define SPI_FREQUENCY 40000000
// #define SPI_FREQUENCY 55000000 // STM32 SPI1 only (SPI2 maximum is 27MHz)
// #define SPI_FREQUENCY 80000000
// Optional reduced SPI frequency for reading TFT
#define SPI_READ_FREQUENCY 20000000
// The XPT2046 requires a lower SPI clock rate of 2.5MHz so we define that here:
#define SPI_TOUCH_FREQUENCY 2500000
LikeLike
Thank You so much Floris, your information helped me a lot. Now I need to find a way to change winddirection – rose to turn 180 degrees and the humidity- py to be displayed correct. But at last I will succeed….! Thanks, Great Job
Alex
LikeLike
Hi Floris do you have any suggestion for the humidity meters (needle and py) Everything is working correctly but the needle of the humidity meter stays permanently horizontal (40%) and the Py scale will not be showed at all. Besides the hum value will be displayed in a normal way in the left upper window. It seems that the hum- variables are not reaching both meters….Any suggestions about this issue?
Thank you in advance,
Alex
LikeLike
Displaying some needle and hum meter issues solved, If you are interested let me know
Alex
LikeLike